- Analisis
- Analisis Teknikal
Emas/Dolar AS Analisis Teknikal - Emas/Dolar AS Berniaga: 2019-08-08
Increased haven demand bullish for XAUUSD
Yuan weakening boosted heaven demand. Will the gold price continue advancing?
Three days ago on Monday yuan breached 7-to-dollar mark to the lowest level in 11 years, triggering a selloff in global financial markets and flight to haven assets. The yuan fell after president Trump announced about 10% tariffs on $300 billion worth of Chinese goods starting from September 1. The yuan has tumbled as much as 2.7% against the dollar over the past three days since the announcement. China’s central bank stabilized the yuan with a fixing Tuesday at 6.9683 yuan per dollar, which brought some calm to financial markets. The US-China trade dispute is the main drag on global economy with the uncertainty driving the demand for haven assets including gold. Recent data point to cooling of US economy: the services sector expansion slowed in July as the ISM Services Composite Index declined to 53.7 from 55.1 in previous month, and job vacancies fell slightly to 7.35 million in June from 7.38 million according to the US Labor Department’s JOLTS report Tuesday. As Beijing halted purchases of US agricultural products after US threat of new tariffs White House economic adviser, Larry Kudlow, said Trump still wants a trade deal and the U.S. plans to host Chinese negotiators in September, but China has to make concessions.
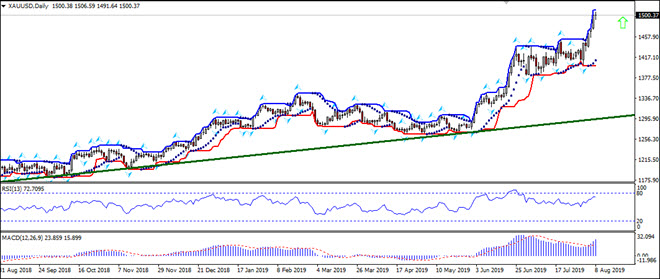
On the daily timeframe the XAUUSD:D1 is rising after trading in a range since end of June.
- The Parabolic indicator has formed a buy signal.
- The Donchian channel indicates upward bias: it has widened up.
- The MACD indicator gives a bullish signal: it is above the signal line and the gap is widening.
- The RSI oscillator is rising but has not reached the overbought zone yet.
We believe the bullish momentum will continue after the price breaches above the upper boundary of Donchian channel at 1510.26. This level can be used as an entry point for placing a pending order to buy. The stop loss can be placed below the last fractal low at 1400.36. After placing the order, the stop loss is to be moved every day to the next fractal low, following Parabolic signals. Thus, we are changing the expected profit/loss ratio to the breakeven point. If the price meets the stop loss level (1400.36) without reaching the order (1510.26), we recommend cancelling the order: the market has undergone internal changes which were not taken into account.
Technical Analysis Summary
| Order | Sell |
| Sell stop | Above 1510.26 |
| Stop loss | Below 1400.36 |
- Dapatkan Sijil

Perhatian:
Kajian berikut adalah berdasarkan maklumat kognitif dan diterbitkan secara percuma. Semua maklumat, terkandung dalam semakan semasa, diperolehi dari sumber umum, diakui sebagai tidak tepat sepenuhnya. Oleh yang demikian tidak dijamin, maklumat yang dipaparkan adalah tepat dan lengkap sepenuhnya. Ulasan kemudian tidak dikemaskini. Segala maklumat pada setiap ulasan, seperti ramalan, petunjuk, carta dan seumpama dengannya, hanya disertakan bagi tujuaan rujukan, dan bukan sebagai nasihat kewangan atau cadangan. Kesemua teks dan sebahagian darinya, dan termasuk juga carta, sesama sekali tidak boleh digunakan sebagai cadangan untuk membuat sebarang transaksi untuk sebarang saham. Syarikat IFC Markets dan pekerjanya tidak akan bertanggungjawab di bawah mana-mana keadaan untuk segala tindakan yang diambil oleh sesiapa selepas atau semasa ulasan.
