- Analisis
- Analisis Teknikal
Kacang Soya Analisis Teknikal - Kacang Soya Berniaga: 2021-05-20
Kacang Soya Ringkasan Analisis Teknikal
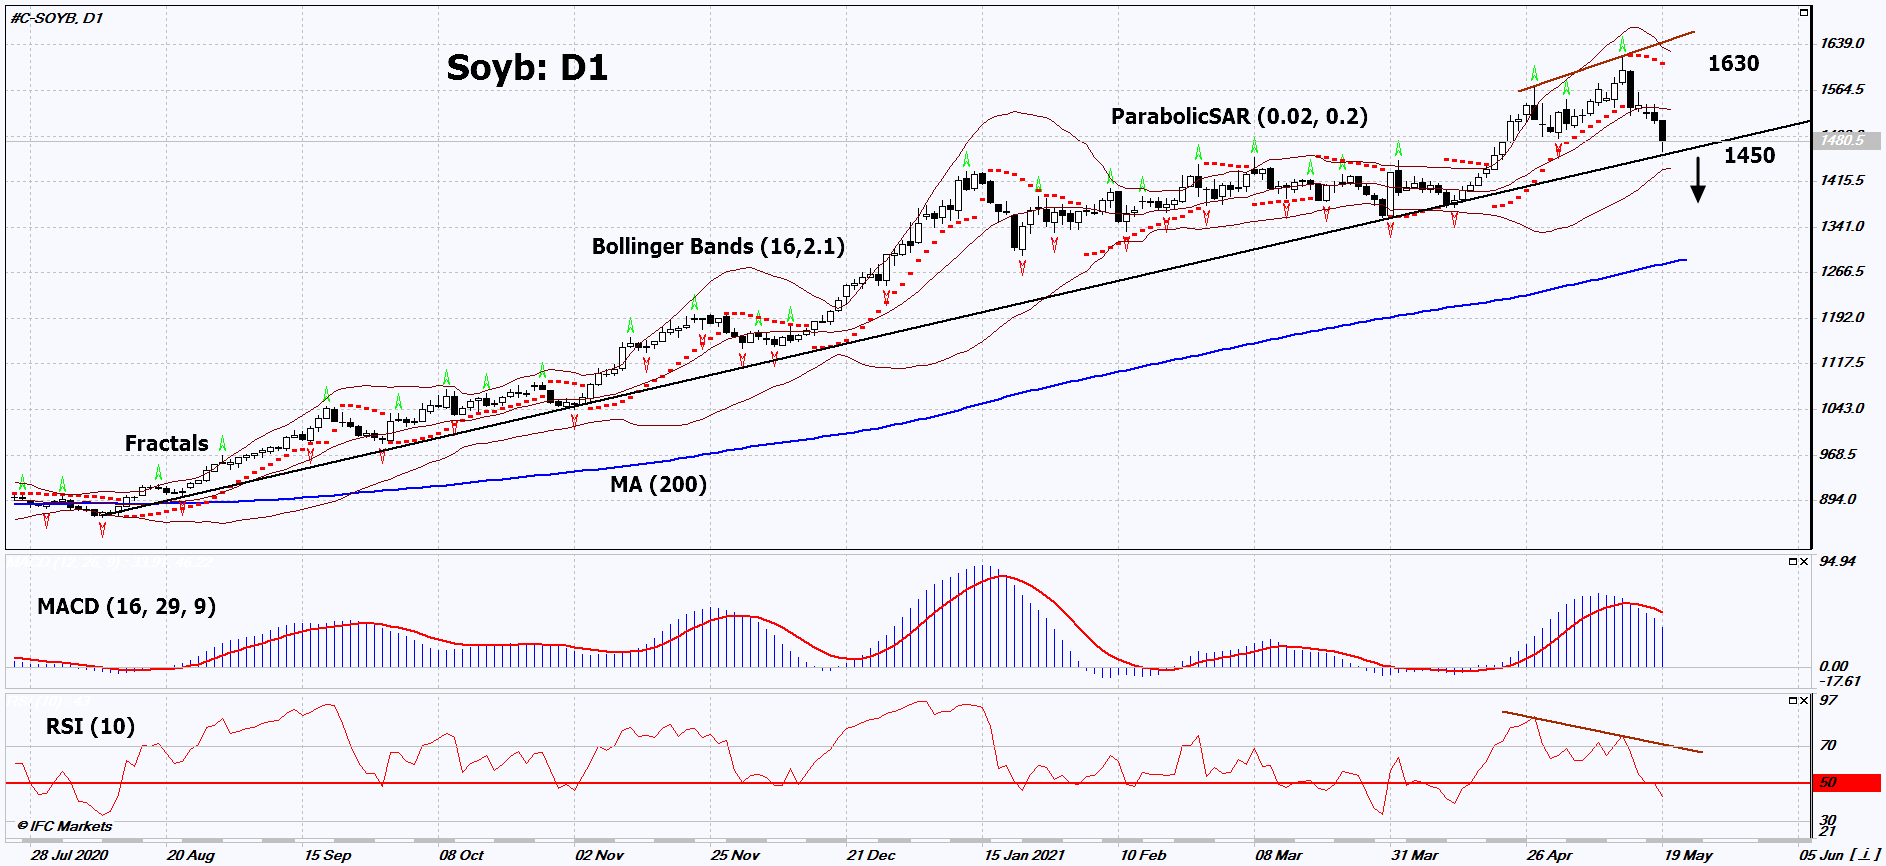
Below 1450
Sell Stop
Above 1630
Stop Loss
| Penunjuk | Isyarat |
| RSI | Sell |
| MACD | Sell |
| MA(200) | berkecuali |
| Fractals | berkecuali |
| Parabolic SAR | Sell |
| Bollinger Bands | berkecuali |
Kacang Soya Analisis carta
Kacang Soya Analisis teknikal
On the daily timeframe, Soyb: D1 approached the uptrend support line. It must fall down before opening a position. A number of technical analysis indicators have formed signals for further decline. We do not rule out a bearish movement if Soyb: D1 falls below the last lower fractal and the uptrend support line: 1450. This level can be used as an entry point. The initial risk limitation is possible above the maximum since July 2013, the upper Bollinger band and the Parabolic signal: 1630. After opening the pending order, we can move the stop-loss following the Bollinger and Parabolic signals to the next fractal maximum. Thus, we change the potential profit / loss ratio in our favor. After the transaction, the most cautious traders can switch to the four-hour chart and set a stop-loss, moving it in the direction of the trend. If the price overcomes the stop-loss (1630) without activating the order (1450), it is recommended to delete the order: there are internal changes in the market that were not taken into account.
Analisis Asas bagi Komoditi - Kacang Soya
Rains in Brazil and the U.S. may increase soybean yields. Will the decline in Soyb quotes continue?
Rainfalls in Brazil may further increase the soybean crop. In the meantime, it is expected that it will reach a record of 144 million tons. Rains are also expected in southern part of the United States. Earlier, the U.S. The Department of Agriculture (USDA) reported a 5.4% increase in the U.S. soybean yields in 2021 compared to 2020, to 87.6 million acres. IHS Markit Agribusiness estimates the cultivated area to be larger, about 88.5 million acres. According to the USDA, this year the U.S. soybean crop is expected to increase by 270 million bushels to 4.4 billion bushels. The USDA predicts an increase in the global soybean crop by 22.6 million tons to 385.5 million tons. The American National Oilseed Processors Association (NOPA) reported that the U.S. processing of soybeans into soybean oil in April was the minimum in 19 months and amounted to 160.3 million bushels. This is much less than expected (168.7 million bushels), as well as the March indicator of 171.7 million bushels. Possibly, the reduction in soybean processing indicates a decrease in demand.
Terokai kami
Syarat Dagangan
- Tersebar dari 0.0 pip
- 30,000+ Instrumen Perdagangan
- Tahap Henti Keluar - Hanya 10%
Bersedia untuk Berdagang?
Buka Akaun Perhatian:
Kajian berikut adalah berdasarkan maklumat kognitif dan diterbitkan secara percuma. Semua maklumat, terkandung dalam semakan semasa, diperolehi dari sumber umum, diakui sebagai tidak tepat sepenuhnya. Oleh yang demikian tidak dijamin, maklumat yang dipaparkan adalah tepat dan lengkap sepenuhnya. Ulasan kemudian tidak dikemaskini. Segala maklumat pada setiap ulasan, seperti ramalan, petunjuk, carta dan seumpama dengannya, hanya disertakan bagi tujuaan rujukan, dan bukan sebagai nasihat kewangan atau cadangan. Kesemua teks dan sebahagian darinya, dan termasuk juga carta, sesama sekali tidak boleh digunakan sebagai cadangan untuk membuat sebarang transaksi untuk sebarang saham. Syarikat IFC Markets dan pekerjanya tidak akan bertanggungjawab di bawah mana-mana keadaan untuk segala tindakan yang diambil oleh sesiapa selepas atau semasa ulasan.


