- Analisis
- Analisis Teknikal
Indeks saham Non-cyclical (FMCG) Analisis Teknikal - Indeks saham Non-cyclical (FMCG) Berniaga: 2019-08-07
The cyclical nature of the American labor market may affect the dynamics of PCI.
In this review, we suggest to consider a personal composite instrument (PCI) Non-cyclical_Stocks - Stock Index Non-cyclic stocks. It reflects the price dynamics of a portfolio of 6 shares of the world's largest companies that produce consumer goods and services. Will the Non-cyclical_Stocks quotations fall?
After the announcement of new duties on Chinese goods, a correction began on the US stock market. Investors fear China’s retaliation and sanctions on US goods. Regarding American companies in the consumer sector, it can be noted that the unemployment rate in the US is now 3.7%. This is a minimum since 1969. The American labor market, as a rule, shows a cyclicality around an average level of 6%. In case of an increase in unemployment to the average historical level, the income of consumer companies may decrease.
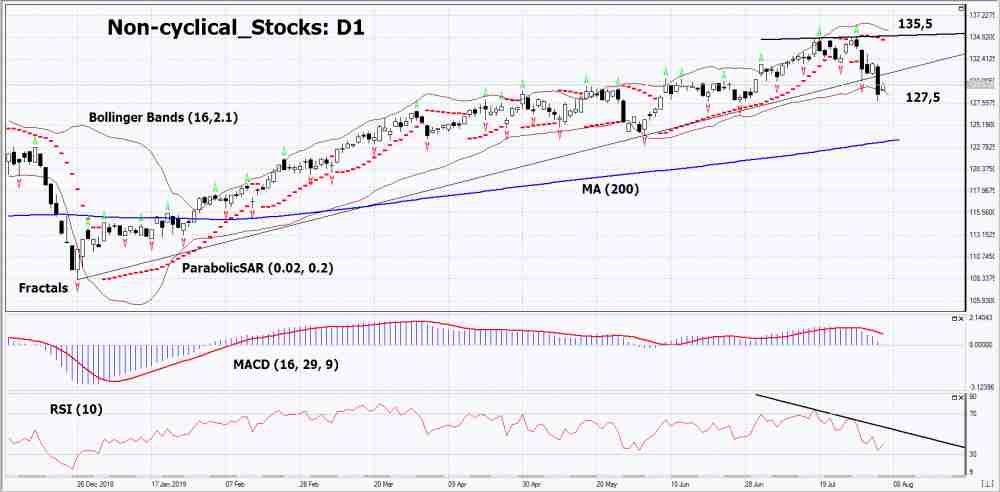
On the daily timeframe Non-cyclical_Stocks: D1 has broken down the uptrend support line. Technical analysis indicators formed a downtrend signal. Further downward correction is possible in case of publication of negative macroeconomic and corporate data.
- The Parabolic indicator demonstrates a downtrend signal.
- The Bolinger bands widened, indicating a volatility increase. Both Bollinger Lines Slope Down.
- The RSI indicator is below the 50 mark . It has formed a divergence to decrease.
- The MACD indicator gives a bearish signal.
The bearish momentum may develop if Non-cyclical_Stocks drops below its last low: 127.5. This level can be used as an entry point. The initial stop lose may be placed higher than the last upper fractal, historical high, Bollinger upper line and Parabolic signal: 135.5. After opening the pending order, the stop shall be moved following the signals of Bollinger and Parabolic to the next fractal minimum. Thus, we are changing the potential profit/loss to the breakeven point. More risk-averse traders may switch to the 4-hour chart after the trade and place a stop loss moving it in the direction of the trade. If the price meets the stop level (135,5) without reaching the order (127,5), we recommend to cancel the order: the market sustains internal changes that were not taken into account.
Technical Analysis Summary
| Position | Sell |
| Sell stop | Below 127,5 |
| Stop loss | Above 135,5 |
- Dapatkan Sijil

Perhatian:
Kajian berikut adalah berdasarkan maklumat kognitif dan diterbitkan secara percuma. Semua maklumat, terkandung dalam semakan semasa, diperolehi dari sumber umum, diakui sebagai tidak tepat sepenuhnya. Oleh yang demikian tidak dijamin, maklumat yang dipaparkan adalah tepat dan lengkap sepenuhnya. Ulasan kemudian tidak dikemaskini. Segala maklumat pada setiap ulasan, seperti ramalan, petunjuk, carta dan seumpama dengannya, hanya disertakan bagi tujuaan rujukan, dan bukan sebagai nasihat kewangan atau cadangan. Kesemua teks dan sebahagian darinya, dan termasuk juga carta, sesama sekali tidak boleh digunakan sebagai cadangan untuk membuat sebarang transaksi untuk sebarang saham. Syarikat IFC Markets dan pekerjanya tidak akan bertanggungjawab di bawah mana-mana keadaan untuk segala tindakan yang diambil oleh sesiapa selepas atau semasa ulasan.
