- Analisis
- Analisis Teknikal
Indeks Saham HK Analisis Teknikal - Indeks Saham HK Berniaga: 2019-06-11
Narrowing trade deficit bullish for HK50
Hong Kong trade deficit declined in May. Will the HK50 rebound continue?
Chinese economic data were positive recently: China’s trade balance was better than expected in May. Exports grew 1.5% in May from a year earlier when a 3.8% decline was forecast. At the same time the trade deficit in Hong Kong decreased to 35.1 billion HK dollars in April from 46.9 billion in the same month a year ago. China is Hong Kong’s top trading partner, and better than expected Chinese economic performance bodes well for Hong Kong’s economy too. And while the continuing US-China trade dispute is a downside risk for Hong Kong stock market it could prompt Beijing to step up stimulus measures before a deal is reached.
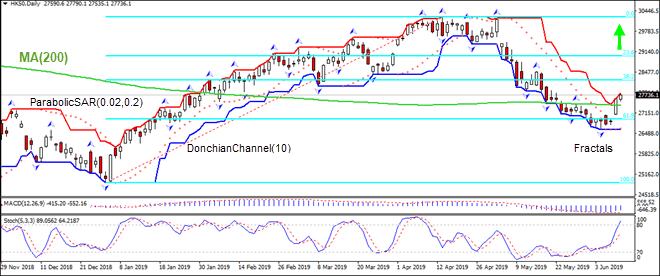
On the daily timeframe HK50: D1 has breached above the 200-day moving average MA(200). This is bullish.
- The Parabolic indicator has formed a buy signal.
- The Donchian channel indicates uptrend: it is widening up.
- The MACD indicator is below the signal line with the gap narrowing. This is a bullish signal.
- The Stochastic oscillator is rising and has breached the overbought zone, this is bearish.
We believe the bullish momentum will continue after the price breaches above the higher Donchian boundary at 27790.1. This level can be used as an entry point for placing a pending order to buy. The stop loss can be placed below the lower Donchian boundary at 26604.6. After placing the pending order the stop loss is to be moved every day to the next fractal lpw, following Parabolic signals. Thus, we are changing the expected profit/loss ratio to the breakeven point. If the price meets the stop-loss level (26604.6) without reaching the order (27790.1) we recommend cancelling the order: the market sustains internal changes which were not taken into account.
Technical Analysis Summary
| Position | Buy |
| Buy Stop | Above 27790.1 |
| Stop loss | Below 26604.6 |
- Dapatkan Sijil

Perhatian:
Kajian berikut adalah berdasarkan maklumat kognitif dan diterbitkan secara percuma. Semua maklumat, terkandung dalam semakan semasa, diperolehi dari sumber umum, diakui sebagai tidak tepat sepenuhnya. Oleh yang demikian tidak dijamin, maklumat yang dipaparkan adalah tepat dan lengkap sepenuhnya. Ulasan kemudian tidak dikemaskini. Segala maklumat pada setiap ulasan, seperti ramalan, petunjuk, carta dan seumpama dengannya, hanya disertakan bagi tujuaan rujukan, dan bukan sebagai nasihat kewangan atau cadangan. Kesemua teks dan sebahagian darinya, dan termasuk juga carta, sesama sekali tidak boleh digunakan sebagai cadangan untuk membuat sebarang transaksi untuk sebarang saham. Syarikat IFC Markets dan pekerjanya tidak akan bertanggungjawab di bawah mana-mana keadaan untuk segala tindakan yang diambil oleh sesiapa selepas atau semasa ulasan.
