- Analisis
- Analisis Teknikal
GBP/USD Analisis Teknikal - GBP/USD Berniaga: 2019-06-05
The United States president supported the exit of the UK from the EU
US President Donald Trump said the UK would benefit from Brexit. Will the British pound quotations increase?
On June 3-5 Donald Trump is in the UK on a state visit. He met with Prime Minister Theresa May, who will leave her post on June 7. The American president said that he would like to see as her follower on the post the representative of the conservative party Boris Johnson, a famous supporter of Brexit. Recall that the exit of the UK from the European Union was postponed and is now scheduled for October 31, 2019. Donald Trump advised Boris Johnson to arrange Brexit in the most rigid scenario, which implies a refusal to pay to the European budget. The American president also spoke about the possibility of expanding mutual trade between the US and the UK and signing a new trade agreement between the two countries after Brexit. Important macroeconomic data for April will be published in UK on June 10, which may affect the pound rate (GDP, industrial production and construction, trade balance and other).
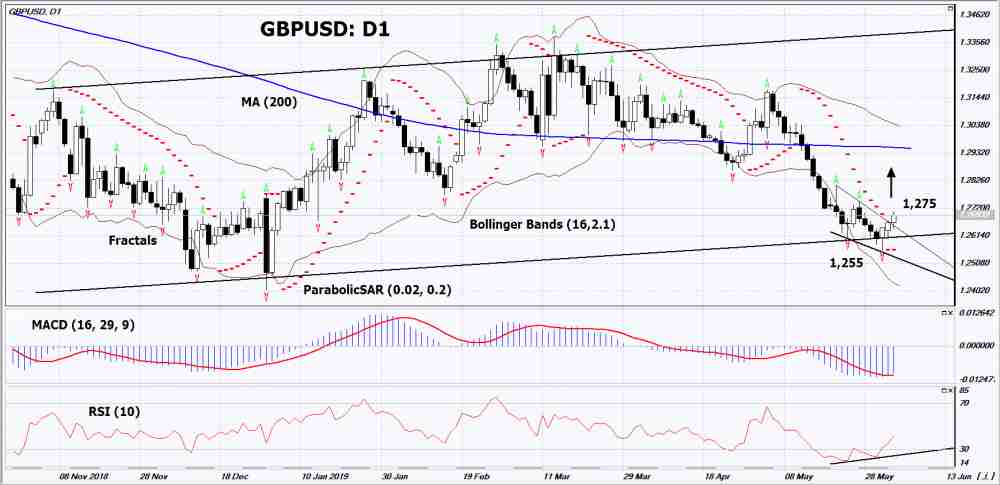
On the daily timeframe GBPUSD: D1 adjusted up from a 5-month low. Various technical analysis indicators have generated an uptrend signals. Further growth of quotations is possible in case of publication of positive macroeconomic data and the signing of a trade agreement between the United States and the United Kingdom.
- The Parabolic indicator shows an uptrend signal.
- The Bolinger bands widened, indicating high volatility.
- The RSI indicator is below 50. It has formed a divergence to the increase.
- The MACD indicator gives a bullish signal.
The bullish momentum may develop in case if GBPUSD exceeds its last higher fractal: 1,275. This level may serve as an entry point. The initial stop loss may be placed below the 5-month minimum, the Parabolic signal and the last lower fractal: 1.255. After opening the pending order, we shall move the stop to the next fractal low following the Bollinger and Parabolic signals. Thus, we are changing the potential profit/loss to the breakeven point. More risk-averse traders may switch to the 4-hour chart after the trade and place a stop loss moving it in the direction of the trade. If the price meets the stop level (1,255) without reaching the order (1,275), we recommend to cancel the order: the market sustains internal changes that were not taken into account.
Technical Analysis Summary
| Position | Buy |
| Buy stop | Above 1,275 |
| Stop loss | Below 1,255 |
- Dapatkan Sijil

Perhatian:
Kajian berikut adalah berdasarkan maklumat kognitif dan diterbitkan secara percuma. Semua maklumat, terkandung dalam semakan semasa, diperolehi dari sumber umum, diakui sebagai tidak tepat sepenuhnya. Oleh yang demikian tidak dijamin, maklumat yang dipaparkan adalah tepat dan lengkap sepenuhnya. Ulasan kemudian tidak dikemaskini. Segala maklumat pada setiap ulasan, seperti ramalan, petunjuk, carta dan seumpama dengannya, hanya disertakan bagi tujuaan rujukan, dan bukan sebagai nasihat kewangan atau cadangan. Kesemua teks dan sebahagian darinya, dan termasuk juga carta, sesama sekali tidak boleh digunakan sebagai cadangan untuk membuat sebarang transaksi untuk sebarang saham. Syarikat IFC Markets dan pekerjanya tidak akan bertanggungjawab di bawah mana-mana keadaan untuk segala tindakan yang diambil oleh sesiapa selepas atau semasa ulasan.
