- Analisis
- Analisis Teknikal
Brent Analisis Teknikal - Brent Berniaga: 2019-01-07
OPEC + Decision on Cutting Production Entered into Force
The decision of OPEC and independent producers to reduce oil production came into force. Will it lead to Brent quotes growth?
Under the OPEC + agreement, the total reduction in oil production should be 1.2 million barrels per day. Of these, the OPEC share is 800 thousand barrels per day, and another 400 thousand must be provided by independent producers. In December, the production of the cartel has already decreased to 460 thousand barrels per day. Mainly due to this, last week, commercial oil reserves in the United States decreased by 4.5 million barrels. This numbers were announced by the independent American Petroleum Institute. According to official information from the Energy Information Administration, oil reserves in the US have grown. The next weekly records, that will be released on Wednesday, can significantly affect the dynamics of oil quotations. Another important influencing factor may be the outcome of the US-China trade negotiations, that will be held during January 7-8, 2019 in Beijing. The reduction of the intensity in mutual trade war can revive the global economy and increase the demand for oil.
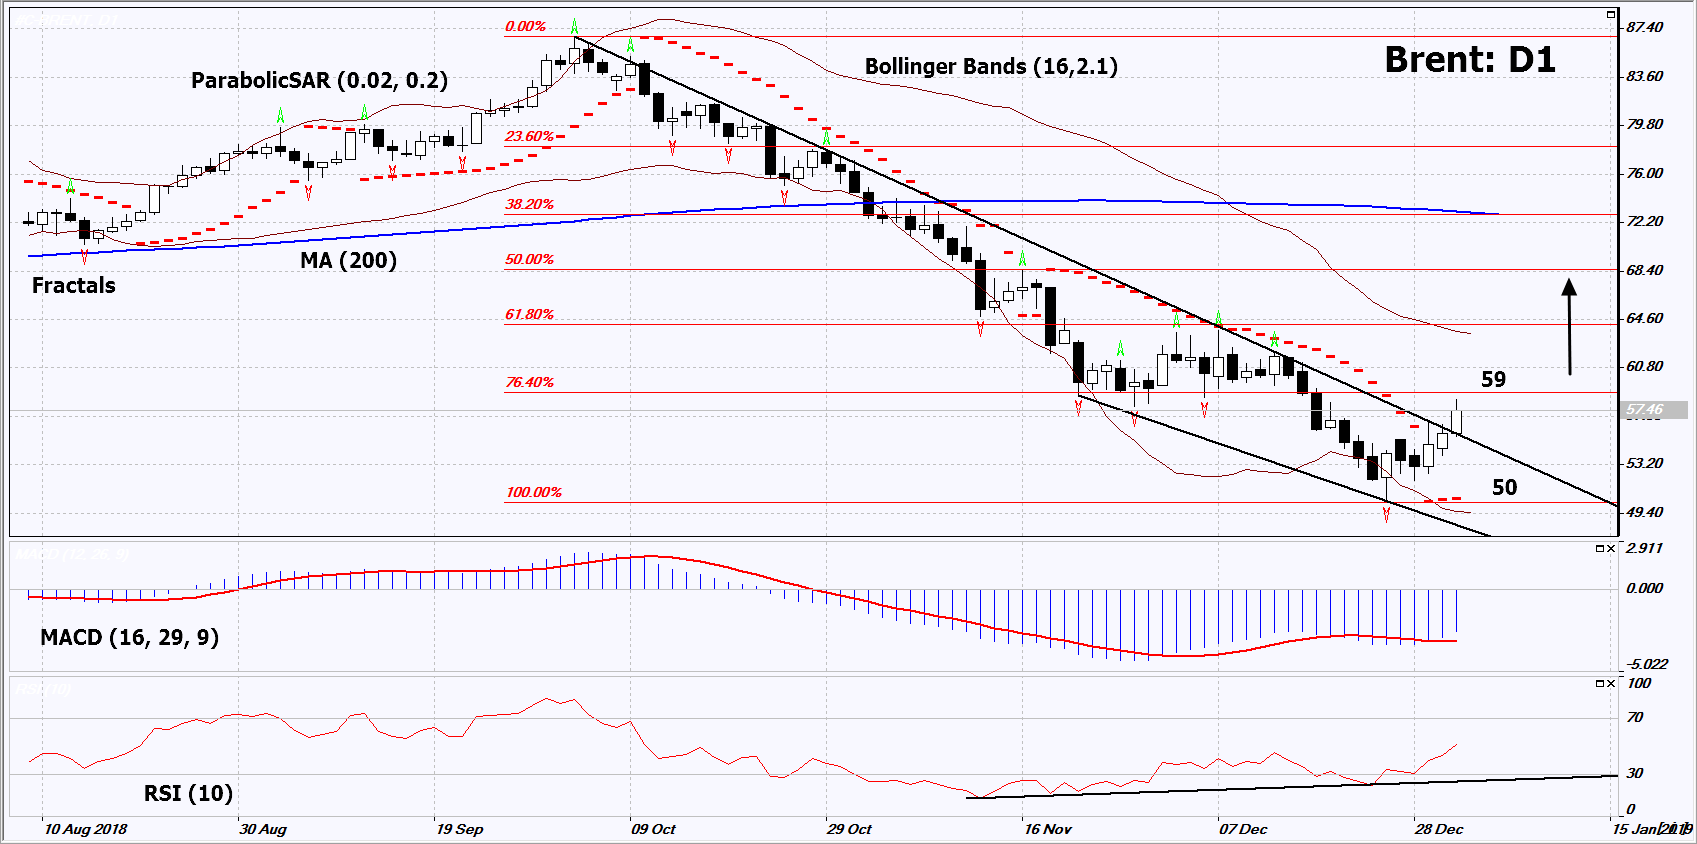
On the daily timeframe, Brent: D1 has broken the downtrend resistance line upwards and adjusts upwards. Further growth of quotations is possible in the event of a reduction in world production and in case of an increase in demand.
- Parabolic indicator shows a signal to increase.
- The Bollinger bands have expanded, indicating a high volatility.
- The RSI indicator is above the 50 mark. It has formed a divergence to increase.
- The MACD indicator shows a signal to increase.
We do not rule out a bullish move if Brent exceeds its last maximum and 1st Fibonacci level: 59. This level can be used as an entry point. The initial risk limit is possibly below the last lower fractal, the minimum since August 2017 and the Parabolic signal: 50. After opening a pending order, move stop following the signals of Bollinger and Parabolic to the next fractal minimum. Thus, we change the potential profit / loss ratio to our advantage. After making a deal, the most cautious traders can switch to a four-hour chart and set a stop loss by moving it in the market direction. If the price overcomes the stop level (50) without activating the order (59), it is recommended to delete the pending order: internal changes occur in the market that were not taken into consideration.
Technical Analysis Summary
| Position | Buy |
| Buy stop | Above 59 |
| Stop loss | Below 50 |
- Dapatkan Sijil

Perhatian:
Kajian berikut adalah berdasarkan maklumat kognitif dan diterbitkan secara percuma. Semua maklumat, terkandung dalam semakan semasa, diperolehi dari sumber umum, diakui sebagai tidak tepat sepenuhnya. Oleh yang demikian tidak dijamin, maklumat yang dipaparkan adalah tepat dan lengkap sepenuhnya. Ulasan kemudian tidak dikemaskini. Segala maklumat pada setiap ulasan, seperti ramalan, petunjuk, carta dan seumpama dengannya, hanya disertakan bagi tujuaan rujukan, dan bukan sebagai nasihat kewangan atau cadangan. Kesemua teks dan sebahagian darinya, dan termasuk juga carta, sesama sekali tidak boleh digunakan sebagai cadangan untuk membuat sebarang transaksi untuk sebarang saham. Syarikat IFC Markets dan pekerjanya tidak akan bertanggungjawab di bawah mana-mana keadaan untuk segala tindakan yang diambil oleh sesiapa selepas atau semasa ulasan.
