- Analisis
- Analisis Teknikal
USD/SGD Analisis Teknikal - USD/SGD Berniaga: 2021-01-20
USD/SGD Ringkasan Analisis Teknikal
Above 1,333
Buy Stop
Below 1,313
Stop Loss
| Penunjuk | Isyarat |
| RSI | Buy |
| MACD | Buy |
| MA(200) | berkecuali |
| Fractals | berkecuali |
| Parabolic SAR | Buy |
| Bollinger Bands | berkecuali |
USD/SGD Analisis carta
USD/SGD Analisis teknikal
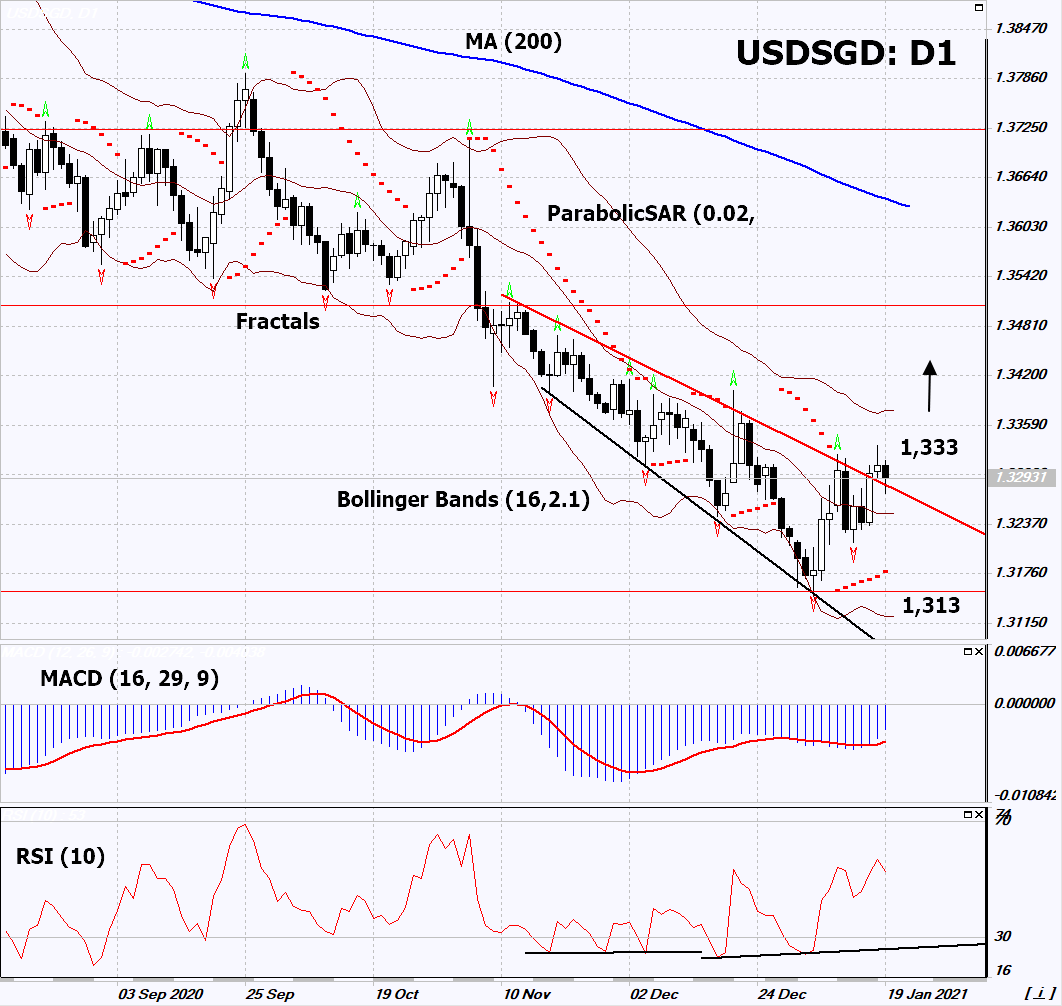
On the daily timeframe, USDSGD: D1 broke through the downtrend resistance line. A number of technical analysis indicators formed signals for further growth. We do not rule out a bullish move if USDSGD rises above the last maximum and the last high fractal: 1.333. This level can be used as an entry point. We can place a stop loss below the minimum since April 2018, the last lower fractal, the lower Bollinger band and the Parabolic signal: 1.313. After opening a pending order, we move the stop loss to the next fractal low following the Bollinger and Parabolic signals. Thus, we change the potential profit/loss ratio in our favor. After the transaction, the most risk-averse traders can switch to the four-hour chart and set a stop loss, moving it in the direction of the bias. If the price meets the stop loss (1.313) without activating the order (1.333), it is recommended to delete the order: the market sustained internal changes that have not been taken into account.
Analisis Asas bagi Forex - USD/SGD
Singapore's export growth may have been driven by a weak base effect. Will the USDSGD quotes move up?
The upward move signifies the weakening of the Singapore dollar against the greenback. In December 2020, Singapore's Non-Oil Exports rose by +6.8% yoy after falling by -5% in November and -3.1% in October. According to Moody’s agency, part of the December growth was due to a low base amid trade wars and a downturn in electronics sales. Recall that at the end of 2020, Singapore's GDP decreased by 6% (according to Moody’s). The decrease in the current account was 20%. The government debt rose to 130% of GDP. December inflation data, which will be released on 25 January, may affect the dynamics of the Singapore dollar. The projected deflation is -0.2 yoy. The Monetary Authority of Singapore (Central Bank of Singapore) rate is 0.06%.
Terokai kami
Syarat Dagangan
- Tersebar dari 0.0 pip
- 30,000+ Instrumen Perdagangan
- Tahap Henti Keluar - Hanya 10%
Bersedia untuk Berdagang?
Buka Akaun Perhatian:
Kajian berikut adalah berdasarkan maklumat kognitif dan diterbitkan secara percuma. Semua maklumat, terkandung dalam semakan semasa, diperolehi dari sumber umum, diakui sebagai tidak tepat sepenuhnya. Oleh yang demikian tidak dijamin, maklumat yang dipaparkan adalah tepat dan lengkap sepenuhnya. Ulasan kemudian tidak dikemaskini. Segala maklumat pada setiap ulasan, seperti ramalan, petunjuk, carta dan seumpama dengannya, hanya disertakan bagi tujuaan rujukan, dan bukan sebagai nasihat kewangan atau cadangan. Kesemua teks dan sebahagian darinya, dan termasuk juga carta, sesama sekali tidak boleh digunakan sebagai cadangan untuk membuat sebarang transaksi untuk sebarang saham. Syarikat IFC Markets dan pekerjanya tidak akan bertanggungjawab di bawah mana-mana keadaan untuk segala tindakan yang diambil oleh sesiapa selepas atau semasa ulasan.

