- Analisis
- Analisis Teknikal
S&P 500 Analisis Teknikal - S&P 500 Berniaga: 2019-01-11
Strong data bullish for SP500
Better than expected December jobs report and ample new job openings attest to US economy strength. Will the SP500 continue the rebound?
The minutes of Federal Reserve December 19 meeting were seen as more dovish than expected: ‘many’ officials thought they could be ‘patient’ on interest rates going forward, before the market slump in Christmas holiday period. They recommended the central bank should be “patient” and “a relatively limited amount of additional tightening” is appropriate. Latest US economic data indicated US economy is strong: better than expected jobs report showed 319000 new jobs were created in December, more than expected. And while the Institute of Supply Management's reading of manufacturing came in lower as was expected, the decline was recorded from a historically high level, and the reading pointing to continued robust expansion in manufacturing sector. The same is true for the services sector. And latest Job Openings and Labor Turnover Survey indicated the number of new job openings still outnumbered unemployed Americans in November despite a decline from October. Positive economic data are bullish for US stock index.
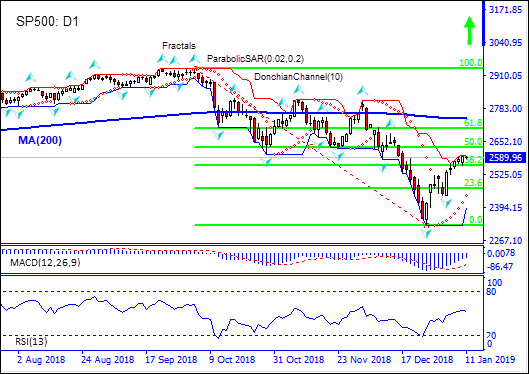
On the daily timeframe the SP500: D1 is above the 38.2 Fibonacci level, this is bullish.
- The Parabolic indicator gives a buy signal.
- The Donchian channel indicates uptrend: it is narrowing up.
- The MACD indicator gives a bullish signal: it is below the signal line and the gap is narrowing.
- The RSI oscillator is falling but has not reached the oversold zone yet.
We believe the bullish momentum will continue after the price closes above the upper boundary of Donchian channel at 2597.72. This level can be used as an entry point for placing a pending order to buy. The stop loss can be placed below the fractal low at 2440.58. After placing the order, the stop loss is to be moved every day to the next fractal low, following Parabolic signals. Thus, we are changing the expected profit/loss ratio to the breakeven point. If the price meets the stop loss level (2440.58) without reaching the order (2597.72), we recommend cancelling the order: the market has undergone internal changes which were not taken into account.
Technical Analysis Summary
| Position | Buy |
| Buy stop | Above 2597.72 |
| Stop loss | Below 2440.58 |
- Dapatkan Sijil

Perhatian:
Kajian berikut adalah berdasarkan maklumat kognitif dan diterbitkan secara percuma. Semua maklumat, terkandung dalam semakan semasa, diperolehi dari sumber umum, diakui sebagai tidak tepat sepenuhnya. Oleh yang demikian tidak dijamin, maklumat yang dipaparkan adalah tepat dan lengkap sepenuhnya. Ulasan kemudian tidak dikemaskini. Segala maklumat pada setiap ulasan, seperti ramalan, petunjuk, carta dan seumpama dengannya, hanya disertakan bagi tujuaan rujukan, dan bukan sebagai nasihat kewangan atau cadangan. Kesemua teks dan sebahagian darinya, dan termasuk juga carta, sesama sekali tidak boleh digunakan sebagai cadangan untuk membuat sebarang transaksi untuk sebarang saham. Syarikat IFC Markets dan pekerjanya tidak akan bertanggungjawab di bawah mana-mana keadaan untuk segala tindakan yang diambil oleh sesiapa selepas atau semasa ulasan.
