- Analisis
- Analisis Teknikal
Indeks Saham HK Analisis Teknikal - Indeks Saham HK Berniaga: 2019-01-10
Improving Hong Kong data bullish for HK50
Contraction in Hong Kong business sector slowed in December. Will the HK50 continue rising?
Latest Hong Kong economic data were positive: the Foreign Exchange Reserves in Hong Kong increased to $424.6 billion in December from 423.2 billion in November. In Hong Kong, Foreign Exchange Reserves are the foreign assets, besides gold and foreign currencies, controlled by the country’s central bank. They hit all time high of $443.4 billion in February of 2018. At the same time contraction in private sector slowed as indicated by the up-tick in Nikkei’s Purchasing Managers’ Index to 48 from 47.1. Improving economic data are bullish for Hong Kong stock index.
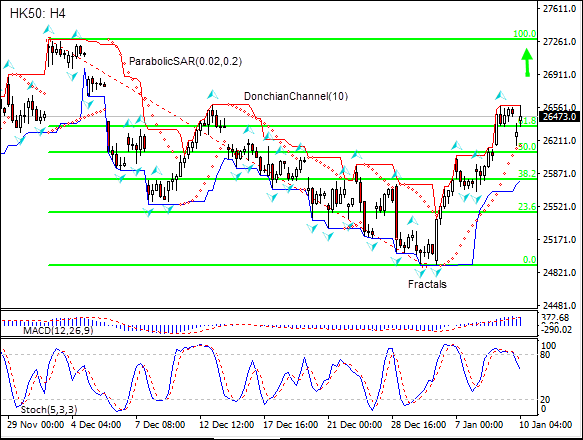
On the 4-hour timeframe the HK50: H4 is above the 61.8 Fibonacci level, this is bullish.
- The Parabolic indicator gives a buy signal.
- The Donchian channel indicates uptrend: it is widening up.
- The MACD indicator gives a bearish signal: it is above the signal line and the gap is narrowing.
- The Stochastic oscillator is falling but has not reached the oversold zone.
We believe the bullish momentum will continue after the price closes above the upper boundary of Donchian channel at 26579.7. This level can be used as an entry point for placing a pending order to buy. The stop loss can be placed below the lower Donchian boundary at 25810.4. After placing the order, the stop loss is to be moved every day to the next fractal low, following Parabolic signals. Thus, we are changing the expected profit/loss ratio to the breakeven point. If the price meets the stop loss level (25810.4) without reaching the order (26579.7), we recommend cancelling the order: the market has undergone internal changes which were not taken into account.
Technical Analysis Summary
| Position | Buy |
| Buy stop | Above 26579.7 |
| Stop loss | Below 25810.4 |
- Dapatkan Sijil

Perhatian:
Kajian berikut adalah berdasarkan maklumat kognitif dan diterbitkan secara percuma. Semua maklumat, terkandung dalam semakan semasa, diperolehi dari sumber umum, diakui sebagai tidak tepat sepenuhnya. Oleh yang demikian tidak dijamin, maklumat yang dipaparkan adalah tepat dan lengkap sepenuhnya. Ulasan kemudian tidak dikemaskini. Segala maklumat pada setiap ulasan, seperti ramalan, petunjuk, carta dan seumpama dengannya, hanya disertakan bagi tujuaan rujukan, dan bukan sebagai nasihat kewangan atau cadangan. Kesemua teks dan sebahagian darinya, dan termasuk juga carta, sesama sekali tidak boleh digunakan sebagai cadangan untuk membuat sebarang transaksi untuk sebarang saham. Syarikat IFC Markets dan pekerjanya tidak akan bertanggungjawab di bawah mana-mana keadaan untuk segala tindakan yang diambil oleh sesiapa selepas atau semasa ulasan.
