- Analisis
- Analisis Teknikal
Dow Jones Analisis Teknikal - Dow Jones Berniaga: 2018-12-27
Dow Jones: Slump or Rebound?
Economic activity expansion slowed in three month period ending in November. Will the DJI stock index slump continue?
The Dow Jones industrial average slumped 2.9% on Christmas Eve, the biggest drop on the session prior to Christmas ever. The latest stock market declines are being attributed to global growth slowing concerns and continued monetary tightening by the Federal Reserve. The statement of the Federal Reserve was seen as more hawkish than expected despite indication of fewer rate increases in 2019 than signaled in its last projections of rate increases at its November meeting by the central bank. The Fed projected 2 rate hikes in 2019, down from 3 seen earlier. However Fed chair Powell stated the pace of balance sheet reduction at $50 billion a month will be maintained. The recent data from Chicago Federal Reserve did little to boost sentiment: while Chicago Fed’s index of national economic activity up-ticked from a downwardly revised neutral reading in October to 0.22 in November, the three-month moving average decreased to positive 0.06 last month, from a downwardly revised positive 0.21 in October. Slowing expansion of economic activity is bearish for stock market index.
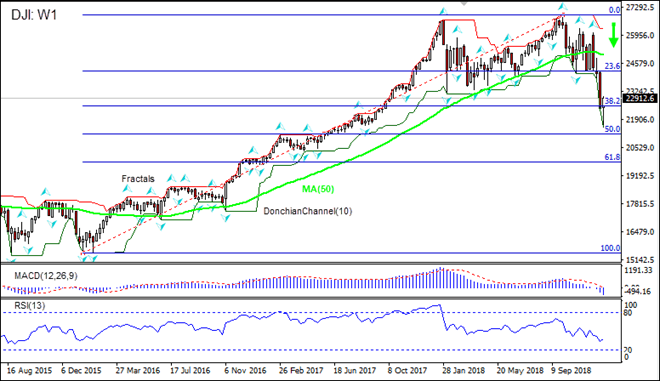
On the weekly timeframe DJI: W1 is testing the Fibonacci retracement level 38.2 counted from the fractal low of the 2016 US presidential election. The price is below the 50-week moving average MA(50) which is falling, this is bearish.
- The Donchian channel indicates downtrend: it is widening lower.
- The MACD indicator is below the signal line and the gap is widening, which is a bearish signal.
- The stochastic oscillator is falling but has not reached the oversold zone.
We believe the bearish momentum will continue after the price closes below the Fibonacci retracement level 38.2 at 22524.60. This level can be used as an entry point for placing a pending order to sell. The stop loss can be placed above the last fractal low at 24114.30. After placing the order, the stop loss is to be moved every day to the next fractal high, following Parabolic signals. Thus, we are changing the expected profit/loss ratio to the breakeven point. If the price meets the stop loss level (24114.30) without reaching the order (22524.60), we recommend cancelling the order: the market has undergone internal changes which were not taken into account.
Technical Analysis Summary
| Position | Sell |
| Sell stop | Below 22524.60 |
| Stop loss | Above 24114.30 |
- Dapatkan Sijil

Perhatian:
Kajian berikut adalah berdasarkan maklumat kognitif dan diterbitkan secara percuma. Semua maklumat, terkandung dalam semakan semasa, diperolehi dari sumber umum, diakui sebagai tidak tepat sepenuhnya. Oleh yang demikian tidak dijamin, maklumat yang dipaparkan adalah tepat dan lengkap sepenuhnya. Ulasan kemudian tidak dikemaskini. Segala maklumat pada setiap ulasan, seperti ramalan, petunjuk, carta dan seumpama dengannya, hanya disertakan bagi tujuaan rujukan, dan bukan sebagai nasihat kewangan atau cadangan. Kesemua teks dan sebahagian darinya, dan termasuk juga carta, sesama sekali tidak boleh digunakan sebagai cadangan untuk membuat sebarang transaksi untuk sebarang saham. Syarikat IFC Markets dan pekerjanya tidak akan bertanggungjawab di bawah mana-mana keadaan untuk segala tindakan yang diambil oleh sesiapa selepas atau semasa ulasan.
