- Analisis
- Analisis Teknikal
Emas/Dolar AS Analisis Teknikal - Emas/Dolar AS Berniaga: 2019-02-12
Gold prices fall amid increasing demand for dollar assets
Gold prices decrease amid the strengthening of the US dollar. As a rule, these two assets move in antiphase and are antagonists of each other. Will the XAUUSD fall?
Last week, the US dollar index showed the maximum weekly growth in six months and updated the 6-week high. Investors consider the precious metal to be a heaven asset amid slowing global economic growth and trade wars. The SPDR Gold Trust fund reported a reduction in reserves of the physical metal for five days in a row last week. Another negative factor for gold prices may be the absence of Chinese investors this week due to the celebration of the New Year according to the lunar calendar.
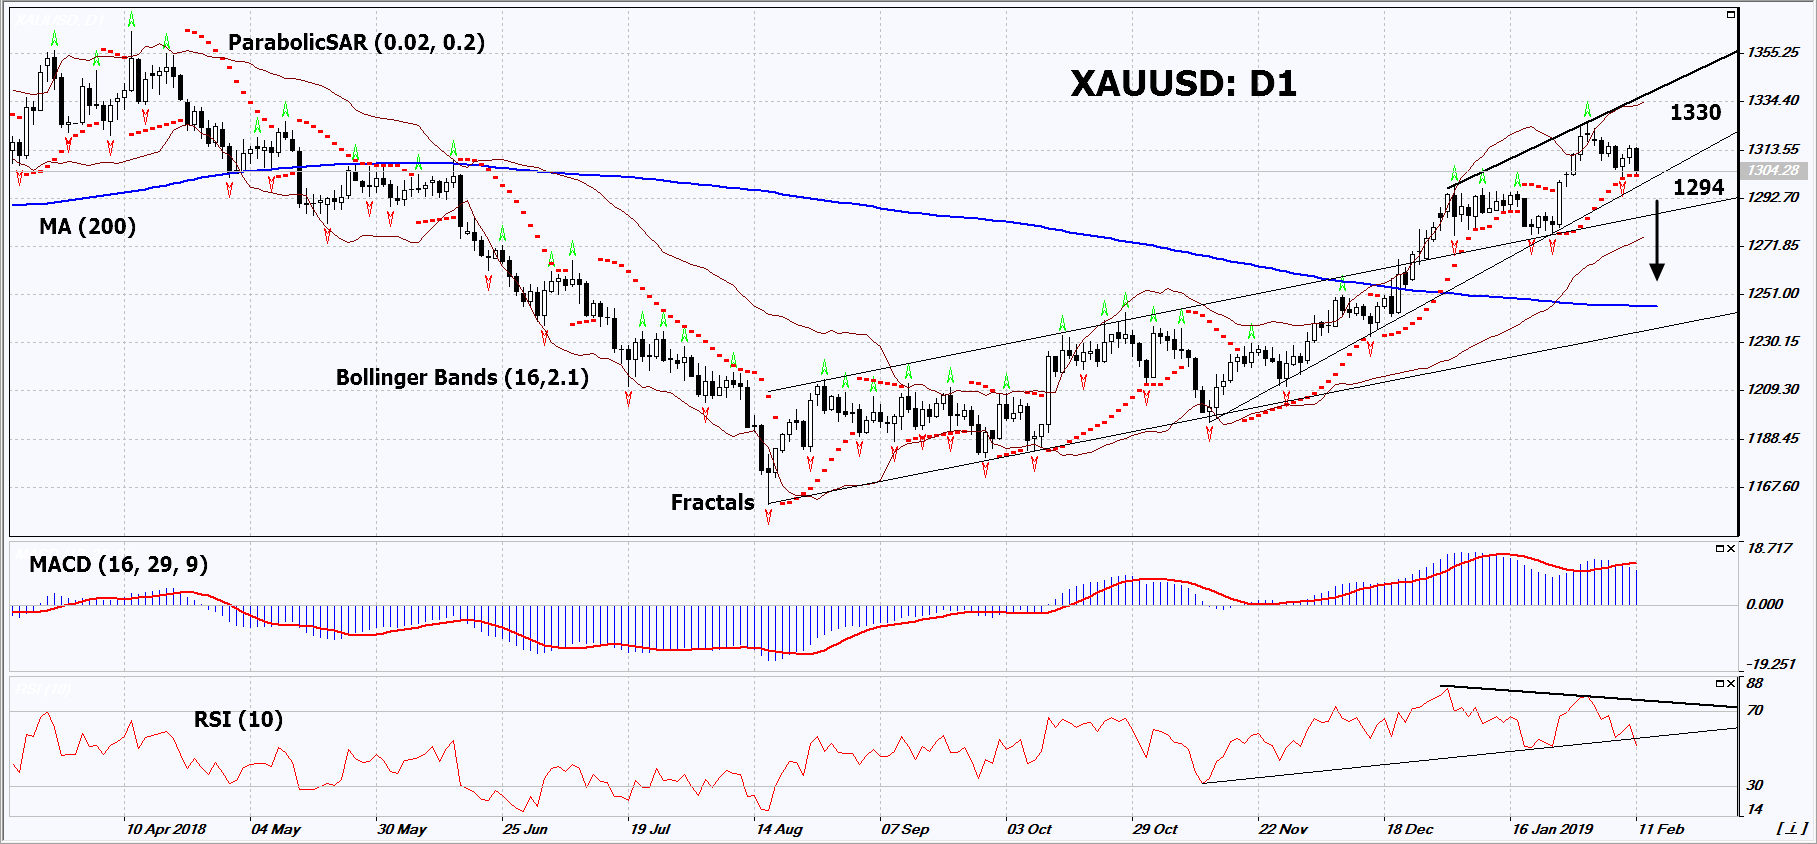
On the daily timeframe, XAUUSD: D1 is in a rising trend. However, the price increase has slowed down and a number of technical analysis indicators have formed sell signals. It is possible in case of the further strengthening of the US dollar.
- The Parabolic indicator gives a bullish signal. It can be used as an additional support level, which should be overcome before opening a sell position.
- The Bollinger bands have widened, which indicates high volatility.
- The RSI indicator is above 50. It has formed a negative divergence.
- The MACD indicator gives a bearish signal.
The bearish momentum may develop in case XAUUSD falls below the last fractal low, the Parabolic signal and the support line of the uptrend at 1294. This level may serve as an entry point. The initial stop loss may be placed above the last fractal high and the 9-month high at 1330. After opening the pending order, we shall move the stop to the next fractal low following the Bollinger and Parabolic signals. Thus, we are changing the potential profit/loss to the breakeven point. More risk-averse traders may switch to the 4-hour chart after the trade and place there a stop loss moving it in the direction of the trade. If the price meets the stop level (1330) without reaching the order (1294), we recommend to close the position: the market sustains internal changes that were not taken into account.
Summary of technical analysis
| Position | Sell |
| Sell stop | Below 1294 |
| Stop loss | Above 1330 |
- Dapatkan Sijil

Perhatian:
Kajian berikut adalah berdasarkan maklumat kognitif dan diterbitkan secara percuma. Semua maklumat, terkandung dalam semakan semasa, diperolehi dari sumber umum, diakui sebagai tidak tepat sepenuhnya. Oleh yang demikian tidak dijamin, maklumat yang dipaparkan adalah tepat dan lengkap sepenuhnya. Ulasan kemudian tidak dikemaskini. Segala maklumat pada setiap ulasan, seperti ramalan, petunjuk, carta dan seumpama dengannya, hanya disertakan bagi tujuaan rujukan, dan bukan sebagai nasihat kewangan atau cadangan. Kesemua teks dan sebahagian darinya, dan termasuk juga carta, sesama sekali tidak boleh digunakan sebagai cadangan untuk membuat sebarang transaksi untuk sebarang saham. Syarikat IFC Markets dan pekerjanya tidak akan bertanggungjawab di bawah mana-mana keadaan untuk segala tindakan yang diambil oleh sesiapa selepas atau semasa ulasan.
