- Analisis
- Analisis Teknikal
Gandum Analisis Teknikal - Gandum Berniaga: 2019-07-12
Lower world wheat ending stock estimate bullish for wheat
Wheat ending stock estimate was lowered in WASDE July report. Will the wheat prices continue rebounding?
Wheat prices are under pressure as harvest gets closer for spring wheat. The US Department of Agriculture revised downward world wheat ending stocks for 2019/20 from previous estimate of 292.43 million metric tons (MMT) to 286.46 MMT in this month’s World Agricultural Supply and Demand Estimates (WASDE) report. Lower wheat ending stock estimate is bullish for wheat. However, USDA upgraded its US all-wheat production estimates from 1.903 billion bushels in June to 1.921 billion bushels due to an increase in winter wheat attributed to better yields. Higher US wheat production is a downside risk for wheat.
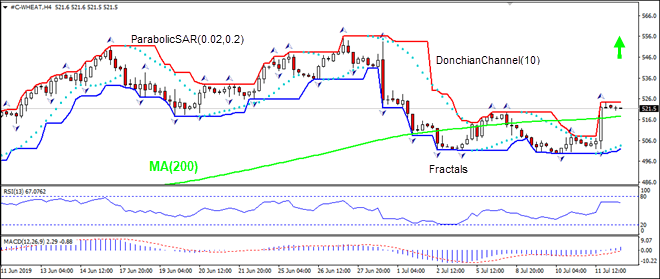
On the 4-hour timeframe the WEHAT: H4 has risen above the 200-period moving average MA(200), this is bullish.
- The Parabolic indicator gives a buy signal.
- The Donchian channel indicates uptrend: it is narrowing up.
- The MACD indicator gives a bullish signal: it is above the signal line and the gap is widening.
- The RSI oscillator has levelled off and has not reached the oversbought zone yet.
We believe the bullish momentum will continue after the price breaches above the upper boundary of Donchian channel at 524.3. This level can be used as an entry point for placing a pending order to buy. The stop loss can be placed below the last fractal low at 502.0. After placing the order, the stop loss is to be moved every day to the next fractal low, following Parabolic signals. Thus, we are changing the expected profit/loss ratio to the breakeven point. If the price meets the stop loss level (502.0) without reaching the order (524.3), we recommend cancelling the order: the market has undergone internal changes which were not taken into account.
Technical Analysis Summary
| Order | Buy |
| Buy stop | Above 524.3 |
| Stop loss | Below 502.0 |
- Dapatkan Sijil

Perhatian:
Kajian berikut adalah berdasarkan maklumat kognitif dan diterbitkan secara percuma. Semua maklumat, terkandung dalam semakan semasa, diperolehi dari sumber umum, diakui sebagai tidak tepat sepenuhnya. Oleh yang demikian tidak dijamin, maklumat yang dipaparkan adalah tepat dan lengkap sepenuhnya. Ulasan kemudian tidak dikemaskini. Segala maklumat pada setiap ulasan, seperti ramalan, petunjuk, carta dan seumpama dengannya, hanya disertakan bagi tujuaan rujukan, dan bukan sebagai nasihat kewangan atau cadangan. Kesemua teks dan sebahagian darinya, dan termasuk juga carta, sesama sekali tidak boleh digunakan sebagai cadangan untuk membuat sebarang transaksi untuk sebarang saham. Syarikat IFC Markets dan pekerjanya tidak akan bertanggungjawab di bawah mana-mana keadaan untuk segala tindakan yang diambil oleh sesiapa selepas atau semasa ulasan.
