- Analisis
- Analisis Teknikal
USD/PLN Analisis Teknikal - USD/PLN Berniaga: 2019-10-08
European Court ruling could help zloty rate
The representative of the National Bank of Poland Lukasz Hardt said that the decision of the European Court of Mortgage Loans does not pose a risk to the Polish banking sector. Will the polish zloty continue growing?
On the chart, it looks like a downtrend movement. Earlier, the European Court ruled that Polish mortgage borrowers have the right to convert their loans into zlotys from Swiss francs. The number of foreign currency mortgages in the country exceeds 700 thousand people, so the demand for zloty has increased. A positive factor was also the confirmation of the statistical service of Poland last year's GDP growth of 5.1%. Recall that in early October, the National Bank of Poland kept the rate at 1.5%. This is significantly higher than the rates of central banks in Western Europe. Inflation in Poland fell in September to 2.6% on an annualized basis from 2.9% in August. The National Bank said it expects its further reduction to 2.3% by the end of 2019. At the same time, GDP growth this year should be 4.3%.
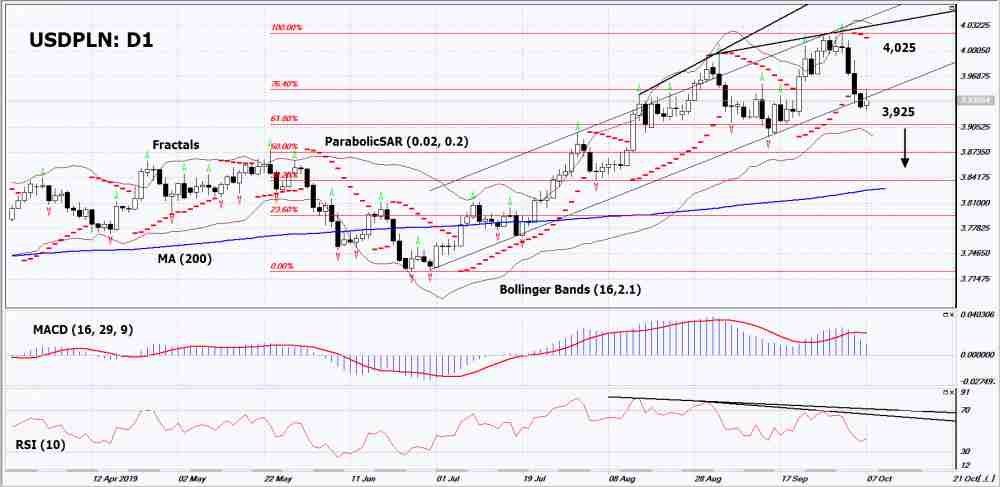
On the daily timeframe USDPLN: D1 approached the support line of the uptrend. Before opening a sell position, it must be broken down. Various technical analysis indicators formed a downward signal. Decrease in quotations is possible in case of publication of positive data on the Polish economy and a weakening US dollar.
- The Parabolic indicator gives a downtrend signal.
- The Bolinger bandswidened, indicating high volatility. Both Bollinger Lines Slope Down.
- The RSI indicator It is below the 50 mark. It has formed a double divergence to fall.
- The MACD indicator gives a bearish signal.
The bearish momentum may develop if USDPLN drops below its last low: 3.925. This level can be used as an entry point. The initial stop- lose may be placed higher than the last upper fractal, the highest since March 2017 and the Parabolic signal: 4.025. After opening the pending order, the stop shall be moved following Bollinger and Parabolic signals to the next fractal minimum. TThus, we are changing the potential profit/loss to the breakeven point. More risk-averse traders may switch to the 4-hour chart after the trade and place a stop loss moving it in the direction of the trade. If the price meets the stop level (4,025) without reaching the order (3,925), we recommend to cancel the order: the market sustains internal changes that were not taken into account.
Technical Analysis Summary
| Position | Sell |
| Sell stop | Below 3,925 |
| Stop loss | Above 4,025 |
- Dapatkan Sijil

Perhatian:
Kajian berikut adalah berdasarkan maklumat kognitif dan diterbitkan secara percuma. Semua maklumat, terkandung dalam semakan semasa, diperolehi dari sumber umum, diakui sebagai tidak tepat sepenuhnya. Oleh yang demikian tidak dijamin, maklumat yang dipaparkan adalah tepat dan lengkap sepenuhnya. Ulasan kemudian tidak dikemaskini. Segala maklumat pada setiap ulasan, seperti ramalan, petunjuk, carta dan seumpama dengannya, hanya disertakan bagi tujuaan rujukan, dan bukan sebagai nasihat kewangan atau cadangan. Kesemua teks dan sebahagian darinya, dan termasuk juga carta, sesama sekali tidak boleh digunakan sebagai cadangan untuk membuat sebarang transaksi untuk sebarang saham. Syarikat IFC Markets dan pekerjanya tidak akan bertanggungjawab di bawah mana-mana keadaan untuk segala tindakan yang diambil oleh sesiapa selepas atau semasa ulasan.
