- Analisis
- Analisis Teknikal
NZD/CAD Analisis Teknikal - NZD/CAD Berniaga: 2019-10-09
Weak construction data is published in Canada
The number of housing starts in Canada decreased in September by 2.5% compared with August and amounted to 221.2 thousand. Will the NZDCAD quotations grow?
Such movement is observed with the strengthening of the New Zealand dollar and the weakening of the Canadian dollar. According to the Canadian Mortgage and Housing Corporation, the volume of new construction of individual urban houses decreased by 9%. Earlier, Canadian business activity indicator Ivey PMI for September fell to a minimum since March 2015 and amounted to 48.7 points. These negative factors may prompt the Bank of Canada to lower the rate at the next meeting on October 30, 2019. Now it is 1.75% with inflation of 1.9% in annual terms. September 11, Canada will release important labor market data for September. Preliminary forecasts are neutral. The US share in Canadian exports in August reached 75%. The main commodity is oil. Accordingly, the decline in world prices for it, as well as possible problems in the US-China trade negotiations, could adversely affect the dynamics of the Canadian dollar. The main trading partner of New Zealand is China and the dynamics of its currency will also depend on negotiations between the United States and China. A positive factor for the New Zealand dollar is government data on a reduction in net debt in the fiscal year 2019/20 to 19.2% of GDP, which is better than the forecast of 20%, as well as a budget surplus of NZ $ 7.5 billion.
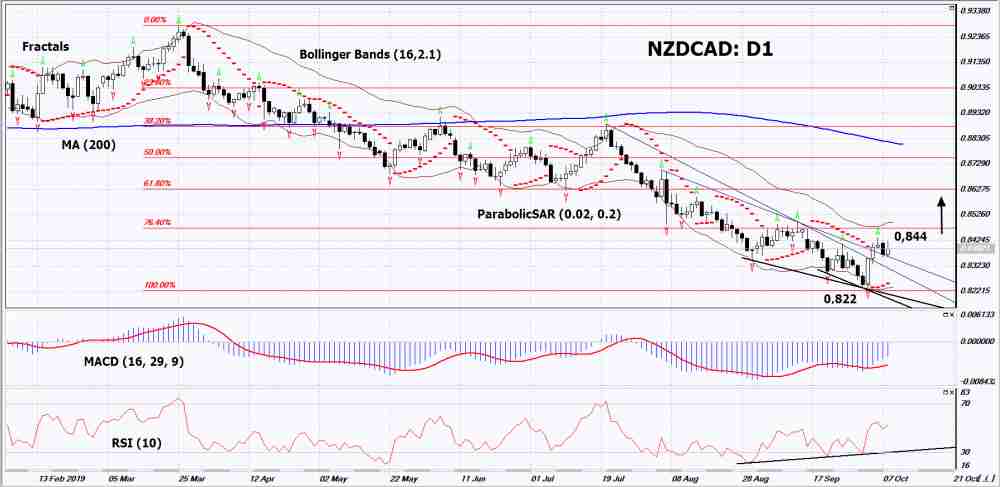
On the daily timeframe NZDCAD: D1 adjusts above from the minimum since April 2014. It has come out of a downtrend and various technical analysis indicators have formed signals to increase. Further growth of quotations is possible if positive macroeconomic data is published in New Zealand and negative - in Canada.
- The Parabolic indicator gives an uptrend signal.
- The Bolinger bands narrowed, indicating a volatility decrease. Both Bollinger Lines Slope Up.
- The RSI indicator is above the 50 mark. It has formed a double divergence to increase.
- The MACD indicator gives a bullish signal.
The bullish momentum may develop if NZDCAD exceeds its last upper fractal: 0.844. This level can be used as an entry point. The initial stop lose may be placed below the minimum since April 2014, the lower Bollinger line, the Parabolic signal and the last lower fractal: 0.822. After opening the pending order, the stop shall be moved following the Bollinger and Parabolic signals to the next fractal minimum. Thus, we are changing the potential profit/loss to the breakeven point. More risk-averse traders may switch to the 4-hour chart after the trade and place a stop loss moving it in the direction of the trade. If the price meets the stop level (0,822) without reaching the order (0,844), we recommend to cancel the order: the market sustains internal changes that were not taken into account.
Technical Analysis Summary
| Position | Buy |
| Buy stop | Above 0,844 |
| Stop loss | Below 0,822 |
- Dapatkan Sijil

Perhatian:
Kajian berikut adalah berdasarkan maklumat kognitif dan diterbitkan secara percuma. Semua maklumat, terkandung dalam semakan semasa, diperolehi dari sumber umum, diakui sebagai tidak tepat sepenuhnya. Oleh yang demikian tidak dijamin, maklumat yang dipaparkan adalah tepat dan lengkap sepenuhnya. Ulasan kemudian tidak dikemaskini. Segala maklumat pada setiap ulasan, seperti ramalan, petunjuk, carta dan seumpama dengannya, hanya disertakan bagi tujuaan rujukan, dan bukan sebagai nasihat kewangan atau cadangan. Kesemua teks dan sebahagian darinya, dan termasuk juga carta, sesama sekali tidak boleh digunakan sebagai cadangan untuk membuat sebarang transaksi untuk sebarang saham. Syarikat IFC Markets dan pekerjanya tidak akan bertanggungjawab di bawah mana-mana keadaan untuk segala tindakan yang diambil oleh sesiapa selepas atau semasa ulasan.
