- Analisis
- Analisis Teknikal
FTSE 100 Analisis Teknikal - FTSE 100 Berniaga: 2019-09-13
Positive data bullish for GB100
UK’s manufacturing output decline was less than expected. Will the GB100 stock index continue advancing?
UK data lately were positive on balance: contraction in manufacturing sector slowed while construction output grew in July. Manufacturing production declined 0.6% over year after 1.4% drop in June, while construction output rose 0.3% after 0.2% decline. And labor market remains strong: data indicated UK jobless rate fell back to lowest since mid-1970 - 3.8% after 3.9% in June. And British lawmakers are opposing Prime Minister Boris Johnson’s actions aimed at leading UK out of European Union without a deal in the end of October. Positive data are bullish for UK’s stock market index.
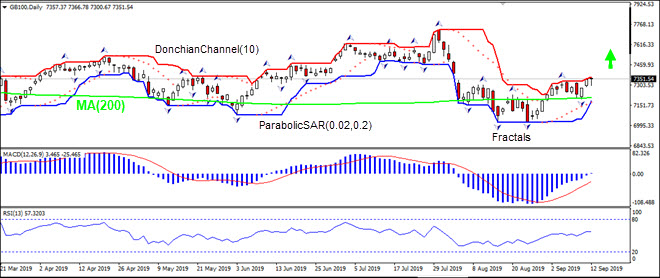
On the daily timeframe GB100: D1 is rising after bouncing off the 200-day moving average MA(200).
- The Donchian channel indicates uptrend: it is narrowing up.
- The Parabolic indicator has formed a buy signal.
- The MACD indicator is about to cross above the signal line and the gap is widening, which is a bullish signal.
- The RSI oscillator is above 50 level but has not reached the overbought zone.
We believe the bullish momentum will continue as the price breaches above the upper boundary of Donchian channel at 7366.78. This level can be used as an entry point for placing a pending order to buy. The stop loss can be placed below the fractal low at 7196.94. After placing the order, the stop loss is to be moved every day to the next fractal low, following Parabolic signals. Thus, we are changing the expected profit/loss ratio to the breakeven point. If the price meets the stop loss level (7196.94) without reaching the order (7366.78), we recommend cancelling the order: the market has undergone internal changes which were not taken into account.
Technical Analysis Summary
| Order | Buy |
| Buy stop | Above 7366.78 |
| Stop loss | Below 7196.94 |
- Dapatkan Sijil

Perhatian:
Kajian berikut adalah berdasarkan maklumat kognitif dan diterbitkan secara percuma. Semua maklumat, terkandung dalam semakan semasa, diperolehi dari sumber umum, diakui sebagai tidak tepat sepenuhnya. Oleh yang demikian tidak dijamin, maklumat yang dipaparkan adalah tepat dan lengkap sepenuhnya. Ulasan kemudian tidak dikemaskini. Segala maklumat pada setiap ulasan, seperti ramalan, petunjuk, carta dan seumpama dengannya, hanya disertakan bagi tujuaan rujukan, dan bukan sebagai nasihat kewangan atau cadangan. Kesemua teks dan sebahagian darinya, dan termasuk juga carta, sesama sekali tidak boleh digunakan sebagai cadangan untuk membuat sebarang transaksi untuk sebarang saham. Syarikat IFC Markets dan pekerjanya tidak akan bertanggungjawab di bawah mana-mana keadaan untuk segala tindakan yang diambil oleh sesiapa selepas atau semasa ulasan.
