- Analisis
- Analisis Teknikal
FTSE 100 Analisis Teknikal - FTSE 100 Berniaga: 2019-02-04
UK companies publish good quarterly earnings reports
The UK’s withdrawal from the European Union without signing a mutual agreement may support an increase in stocks of British companies. Will the GB100 rise?
The weakening of the pound increases the competitiveness of UK companies in foreign markets. The FTSE 100 stock index rose on Friday for the 4th consecutive day. Its growth during a week has been the highest since December 2016. Last week, the British pound showed the maximum decline in the last 7 weeks in anticipation of the next vote in the British Parliament regarding Brexit. It should take place on February 13. The UK’s exit from the EU is scheduled on March 29, 2019. Market participants believe that the Bank of England will support national companies and maintain its super-loose monetary policy at the next meeting on February 7. Additional positive factors for the British stock index were good earnings reports for the 4th quarter of such large companies as Royal Dutch Shell and Diageo. Let us note that the FTSE 100 is now trading with a relatively low P/E ratio of 11.2.
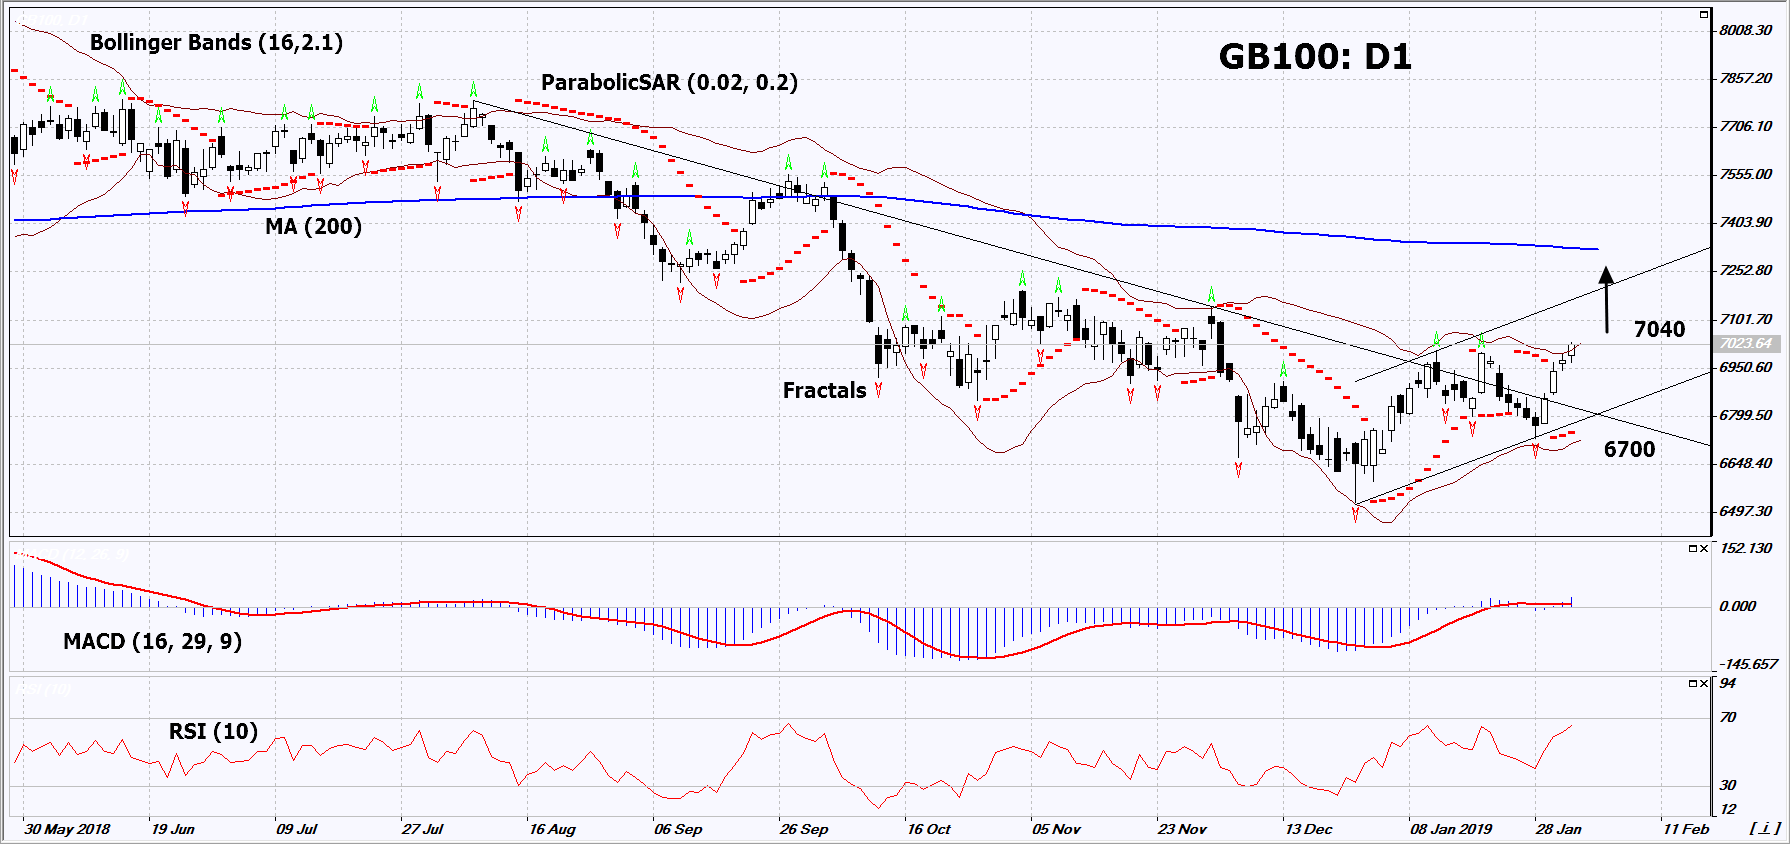
On the daily timeframe, GB100: D1 has moved from the downtrend to the uptrend. The further price increase is possible in case of the publication of positive quarterly earnings reports of UK companies and good political news.
- The Parabolic indicator gives a bullish signal.
- The Bollinger bands have narrowed, which indicates low volatility. Both Bollinger bands are titled upwards.
- The RSI indicator is above 50, but it has not reached the overbought area yet. No divergence.
- The MACD indicator gives a bullish signal.
The bullish momentum may develop in case GB100 exceeds the last high, the two fractal highs and the upper Bollinger band at 7040. This level may serve as an entry point. The initial stop loss may be placed below the last fractal low, the parabolic signal and the lower Bollinger band at 6700. After opening the pending order, we shall move the stop to the next fractal low following the Bollinger and Parabolic signals. Thus, we are changing the potential profit/loss to the breakeven point. More risk-averse traders may switch to the 4-hour chart after the trade and place there a stop loss moving it in the direction of the trade. If the price meets the stop level (6700) without reaching the order (7040), we recommend to close the position: the market sustains internal changes that were not taken into account.
Summary of technical analysis
| Position | Buy |
| Buy stop | Above 7040 |
| Stop loss | Below 6700 |
- Dapatkan Sijil

Perhatian:
Kajian berikut adalah berdasarkan maklumat kognitif dan diterbitkan secara percuma. Semua maklumat, terkandung dalam semakan semasa, diperolehi dari sumber umum, diakui sebagai tidak tepat sepenuhnya. Oleh yang demikian tidak dijamin, maklumat yang dipaparkan adalah tepat dan lengkap sepenuhnya. Ulasan kemudian tidak dikemaskini. Segala maklumat pada setiap ulasan, seperti ramalan, petunjuk, carta dan seumpama dengannya, hanya disertakan bagi tujuaan rujukan, dan bukan sebagai nasihat kewangan atau cadangan. Kesemua teks dan sebahagian darinya, dan termasuk juga carta, sesama sekali tidak boleh digunakan sebagai cadangan untuk membuat sebarang transaksi untuk sebarang saham. Syarikat IFC Markets dan pekerjanya tidak akan bertanggungjawab di bawah mana-mana keadaan untuk segala tindakan yang diambil oleh sesiapa selepas atau semasa ulasan.
