- Analisis
- Analisis Teknikal
Dow Jones Analisis Teknikal - Dow Jones Berniaga: 2019-02-07
Strong data bullish for DJI
Dow Jones Industrial Average Analisis carta

Dow Jones Industrial Average Analisis teknikal
Continuing expansion in private sector indicates US economy is strong. Will the DJI continue the rebound?
Data after the Federal Reserve January 29-30 meeting were positive on balance indicating the US economy is strong. The Institute of Supply Management's manufacturing index’s final reading for January came in better than expected. The US economy created above-expected 304,000 new jobs in January as labor force participation rose. And while the services section expansion slowed in January, the expansion still continued at robust pace with employment and prices rising in the sector. The only weak spot were the drop in factory orders for November. Positive economic data are bullish for Dow Jones US stock index.
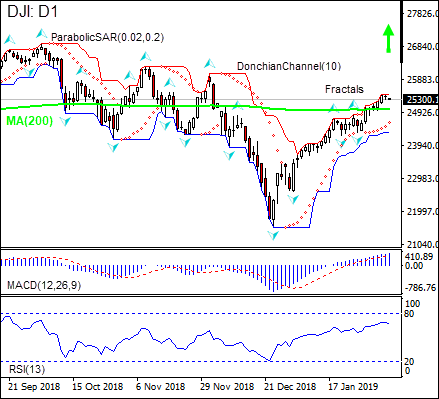
On the daily timeframe the DJI: D1 is above the 200-day moving average MA(200), this is bullish.
- The Parabolic indicator gives a buy signal.
- The Donchian channel indicates no trend yet: it is flat.
- The MACD indicator gives a bullish signal: it is above the signal line and the gap is widening.
- The RSI oscillator is falling but has not reached the oversold zone yet.
We believe the bullish momentum will continue after the price closes above the upper boundary of Donchian channel at 25434.7. This level can be used as an entry point for placing a pending order to buy. The stop loss can be placed below the fractal low at 24315.6. After placing the order, the stop loss is to be moved every day to the next fractal low, following Parabolic signals. Thus, we are changing the expected profit/loss ratio to the breakeven point. If the price meets the stop loss level (24315.6) without reaching the order (25434.7), we recommend cancelling the order: the market has undergone internal changes which were not taken into account.
Technical Analysis Summary
| Position | Buy |
| Buy stop | Above 25434.7 |
| Stop loss | Below 24315.6 |
Analisis Asas bagi - "}[/T]
- Dapatkan Sijil

Perhatian:
Kajian berikut adalah berdasarkan maklumat kognitif dan diterbitkan secara percuma. Semua maklumat, terkandung dalam semakan semasa, diperolehi dari sumber umum, diakui sebagai tidak tepat sepenuhnya. Oleh yang demikian tidak dijamin, maklumat yang dipaparkan adalah tepat dan lengkap sepenuhnya. Ulasan kemudian tidak dikemaskini. Segala maklumat pada setiap ulasan, seperti ramalan, petunjuk, carta dan seumpama dengannya, hanya disertakan bagi tujuaan rujukan, dan bukan sebagai nasihat kewangan atau cadangan. Kesemua teks dan sebahagian darinya, dan termasuk juga carta, sesama sekali tidak boleh digunakan sebagai cadangan untuk membuat sebarang transaksi untuk sebarang saham. Syarikat IFC Markets dan pekerjanya tidak akan bertanggungjawab di bawah mana-mana keadaan untuk segala tindakan yang diambil oleh sesiapa selepas atau semasa ulasan.
