- Analisis
- Analisis Teknikal
Tembaga Analisis Teknikal - Tembaga Berniaga: 2019-09-10
Improving Chinese economy prospect bullish for copper price
China’s manufacturing sector resumed growth in August. Will the copper price advance continue?
Caixin and Markit reported China's factory activity rebounded to a five-month high in August. Caixin China manufacturing purchasing managers' index rose to 50.4 in August compared with 49.9 in July. Manufacturing activity resumed expanding: readings above 50.0 indicate sector expansion, and contraction below. Caixin had mentioned the uncertainty of US-China trade dispute as a downside risk. Last Thursday China’s commerce ministry stated Beijing and Washington had set a tentative date for “early October” meeting for resuming trade negotiations. Improving prospect of US-China trade dispute resolution raises Chinese economy’s growth rate estimate. And China’s central bank last Friday cut the amount of cash that banks must hold as reserves for the third time this year, releasing 900 billion yuan ($126.35 billion) in liquidity to stimulate the economy. Improving growth prospect and stimulus measures for China, world’s biggest consumer of copper, is bullish for copper.
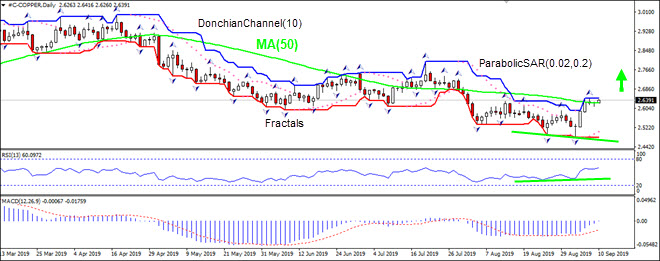
On the daily timeframe COPPER: D1 is retracing higher after hitting 29-month low in the beginning of September. It is testing the 50-day moving average MA(50), which is falling.
- The Parabolic indicator has formed a buy signal.
- The Donchian channel indicates no trend yet: it is flat.
- The MACD indicator is below the signal line with the gap narrowing. This is a bullish signal.
- The RSI oscillator has not reached the overbought zone and has formed a bullish divergence.
We believe the bullish momentum will continue after the price breaches above the upper Donchian boundary at 2.6467. This level can be used as an entry point for placing a pending order to buy. The stop loss can be placed below the lower fractal at 2.4804. After placing the pending order the stop loss is to be moved every day to the next fractal low, following Parabolic signals. Thus, we are changing the expected profit/loss ratio to the breakeven point. If the price meets the stop-loss level (2.4804) without reaching the order (2.6467) we recommend cancelling the order: the market sustains internal changes which were not taken into account.
Technical Analysis Summary
| Order | Buy |
| Buy Stop | Above 2.6467 |
| Stop loss | Below 2.4804 |
- Dapatkan Sijil

Perhatian:
Kajian berikut adalah berdasarkan maklumat kognitif dan diterbitkan secara percuma. Semua maklumat, terkandung dalam semakan semasa, diperolehi dari sumber umum, diakui sebagai tidak tepat sepenuhnya. Oleh yang demikian tidak dijamin, maklumat yang dipaparkan adalah tepat dan lengkap sepenuhnya. Ulasan kemudian tidak dikemaskini. Segala maklumat pada setiap ulasan, seperti ramalan, petunjuk, carta dan seumpama dengannya, hanya disertakan bagi tujuaan rujukan, dan bukan sebagai nasihat kewangan atau cadangan. Kesemua teks dan sebahagian darinya, dan termasuk juga carta, sesama sekali tidak boleh digunakan sebagai cadangan untuk membuat sebarang transaksi untuk sebarang saham. Syarikat IFC Markets dan pekerjanya tidak akan bertanggungjawab di bawah mana-mana keadaan untuk segala tindakan yang diambil oleh sesiapa selepas atau semasa ulasan.
